In flow map management, you can perform the following tasks:
- Search Node
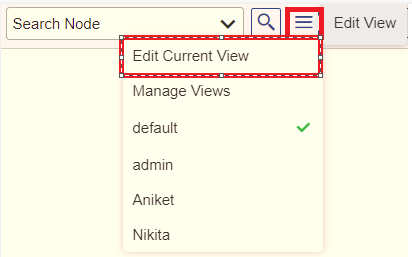
- Edit View
- View the Default Flow Map view
- Save
- Pause/Start request
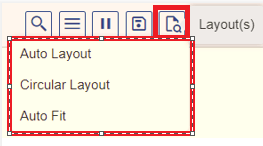
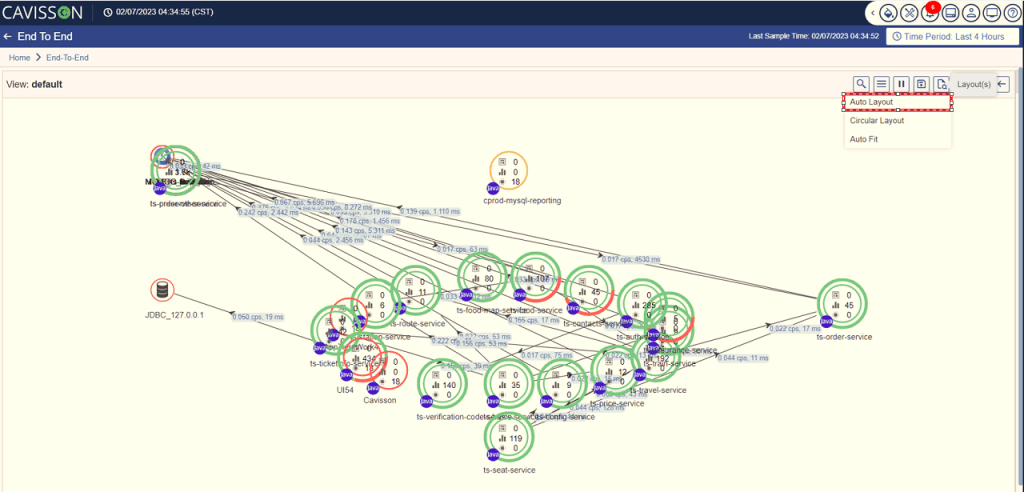
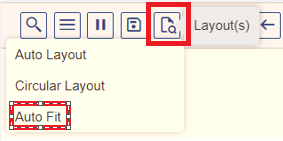
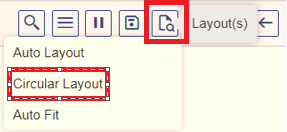
- Layout
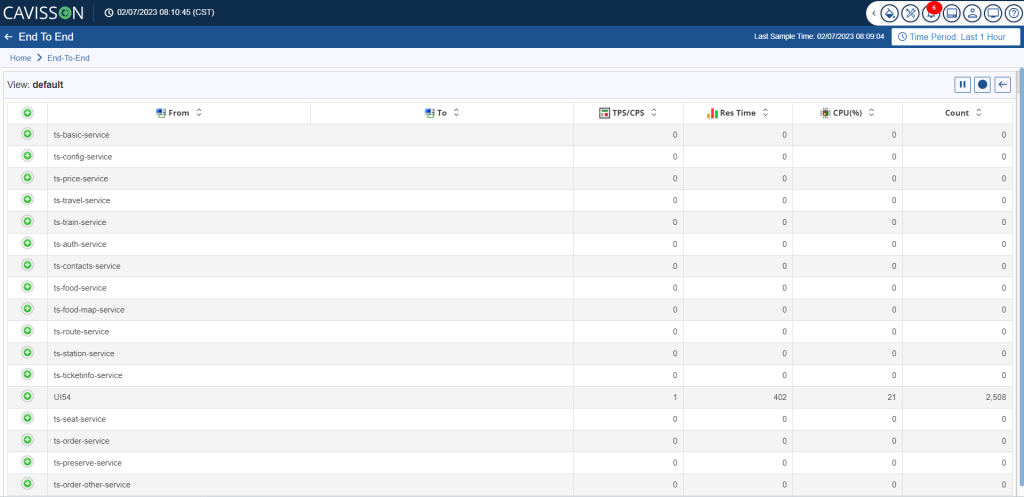
- Grid View
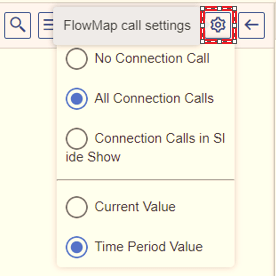
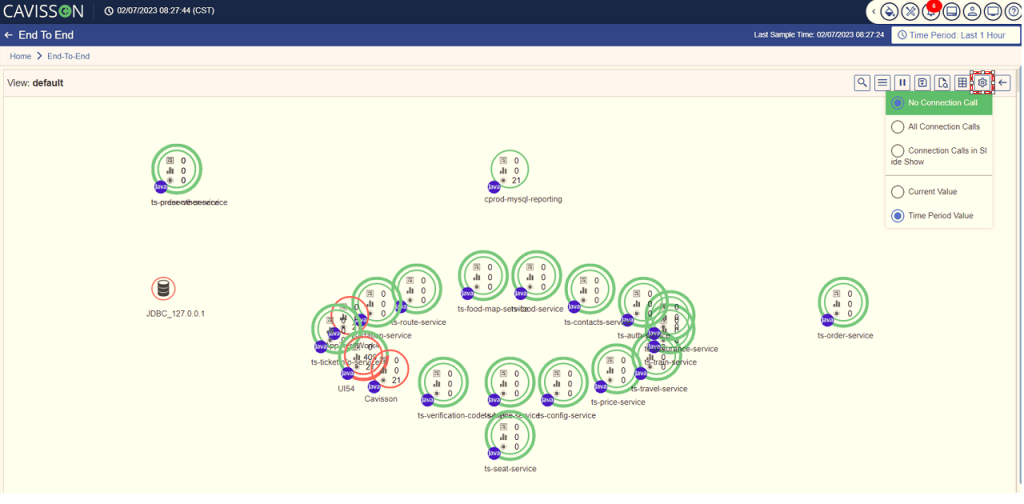
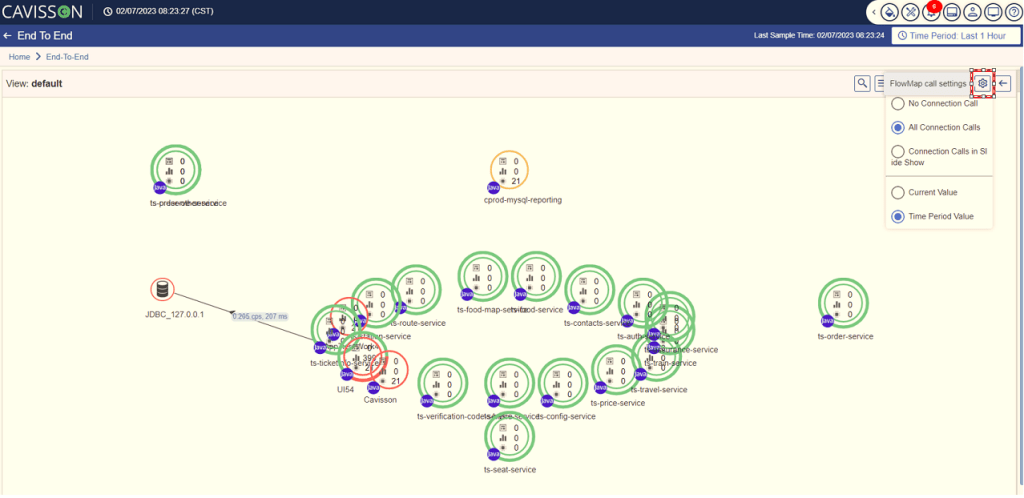
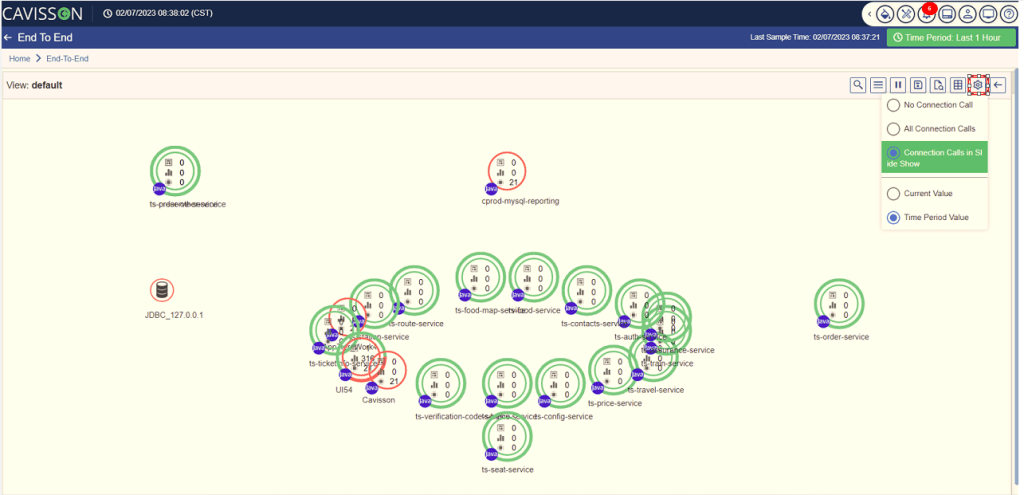
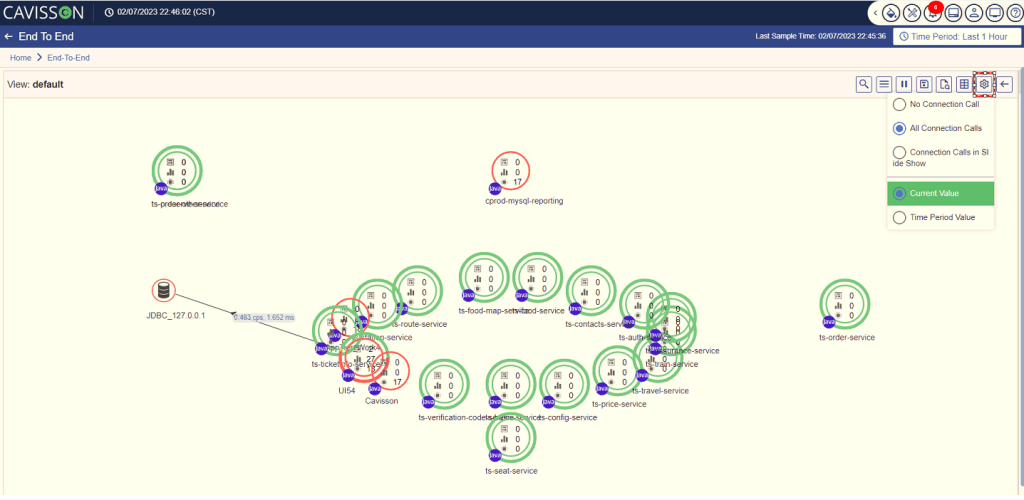
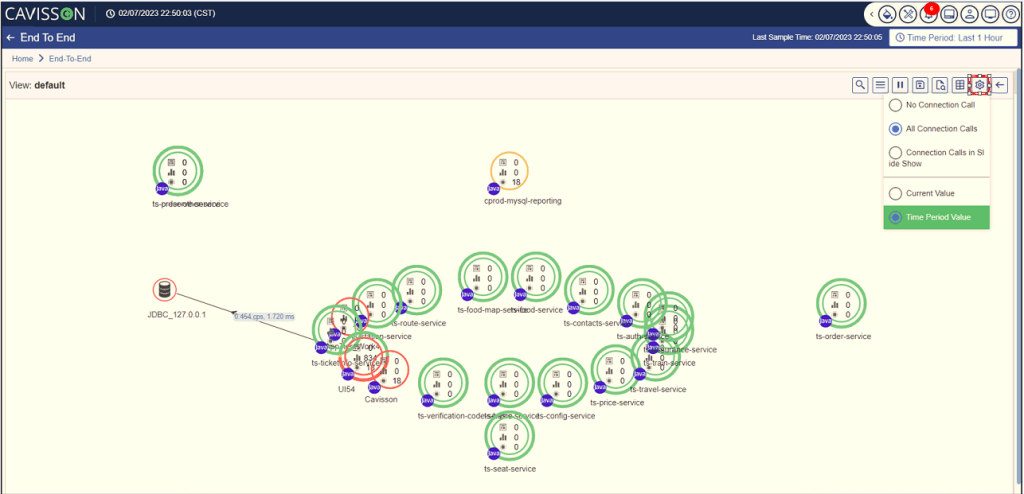
- Flow Map Call Settings
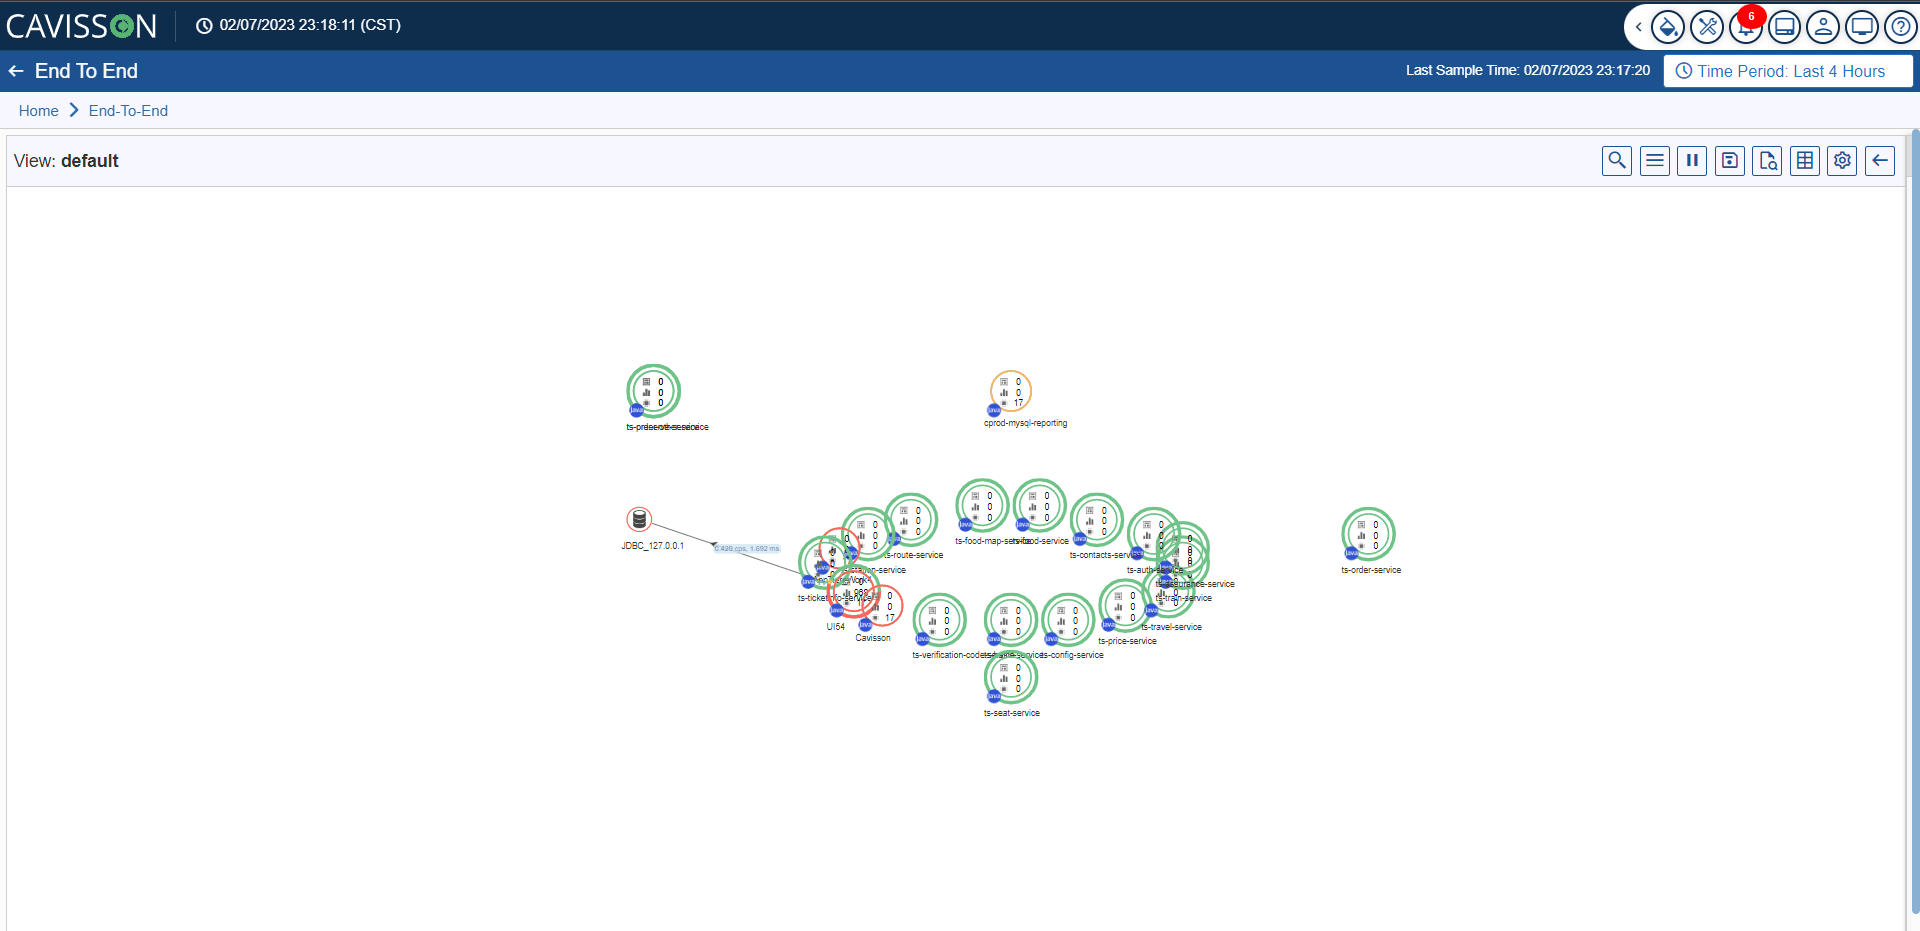
- Maximize/Minimize the Flow Map View
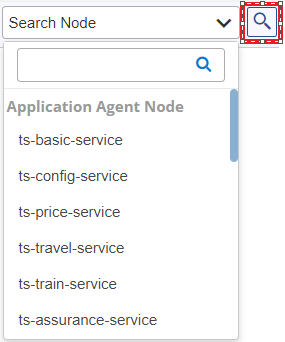
Search a Node
You can search for Tiers and IPs by clicking the Search Node ![]() icon. After searching, the searched Tier/IP is highlighted for 10 seconds, and then the highlight disappears.
icon. After searching, the searched Tier/IP is highlighted for 10 seconds, and then the highlight disappears.
- After configuration, click the Apply
 The flowmap is displayed based on the configuration of the fields.
Example
In this example, we have performed the following tasks:
Input
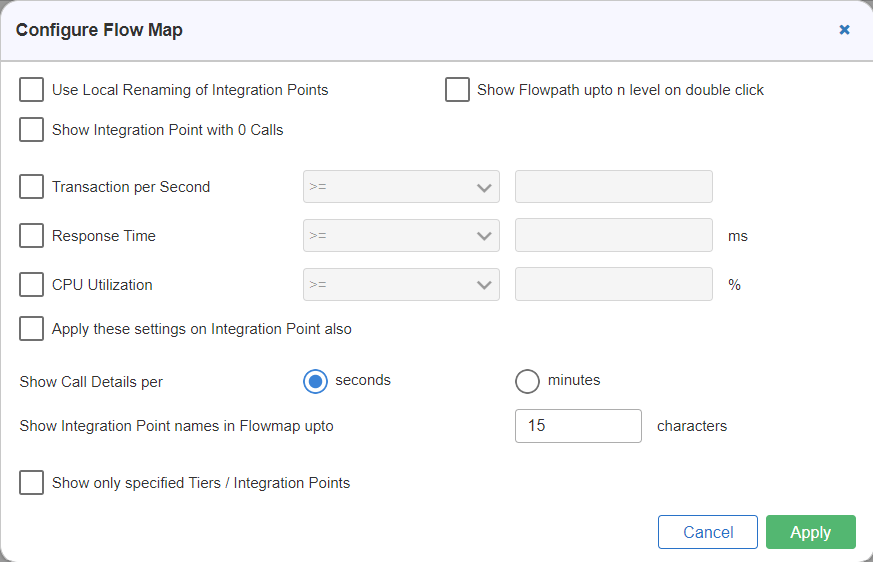
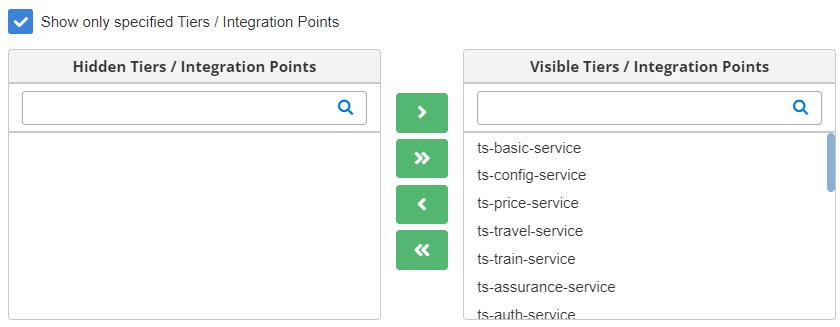
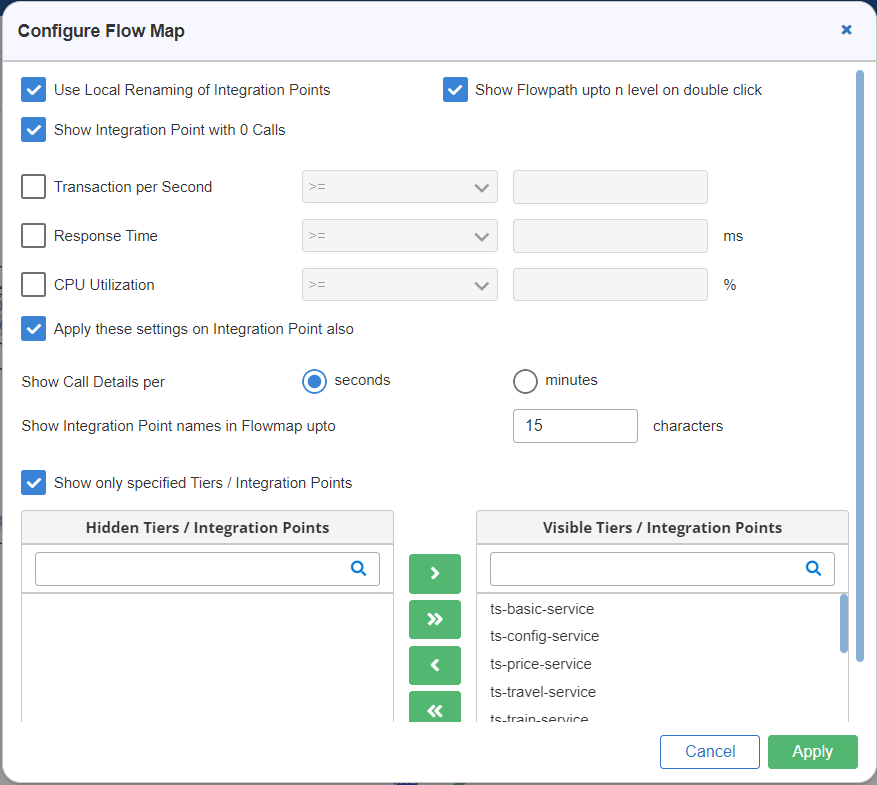
- Select the Use Local Renaming of Integration Points check box.
- Select the Show Integration Point with 0 Calls check box.
- Apply the Transaction per second filter and it should be less than or equal to 3.
Select Apply these settings on Integration Point also check box as shown in Figure 14.
Manage Views
Manage Flow Map feature of Application End-to-End View is used for the following purposes:
- To set as default flow map.
- To make a flow map shareable with other owners.
- To remove a flow map.
To View the Manage Flow Map Window, follow the steps mentioned below:
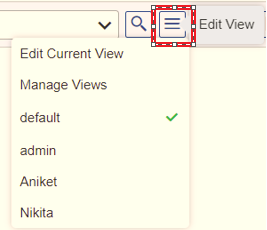
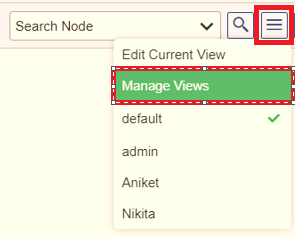
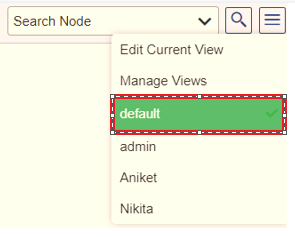
- Hover the mouse on the Edit View
 icon, and then click the Manage Views option as shown in Figure 16.
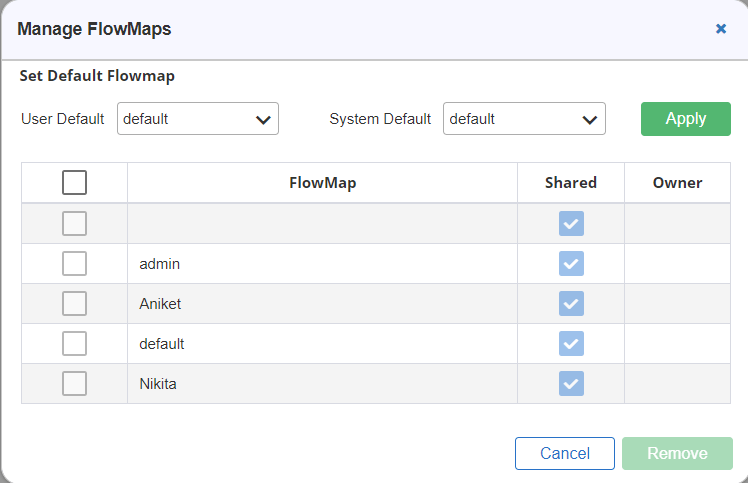
To Set as Default Flow Map
Select the desired flow map from the Default Flowmap drop-down list and click Apply button.
To Make a Flow Map Shareable
Making a flow map shareable means that it can be viewed by other owners as well. To enable this, select the Shared check box corresponding to the flow map.
To Remove a Flow Map
To remove a flow map, select the flow map and click the Remove ![]() button, the flow map is removed from the list.
button, the flow map is removed from the list.
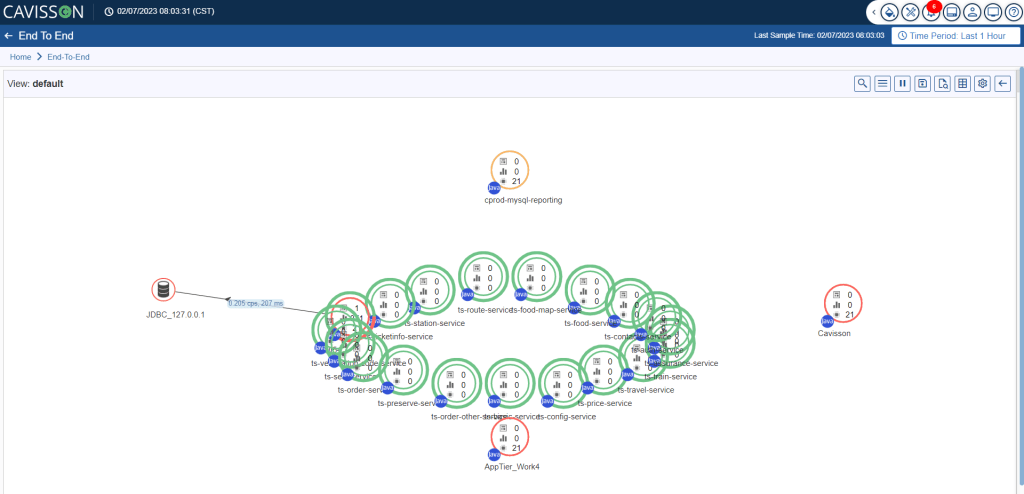
Default Flow Map
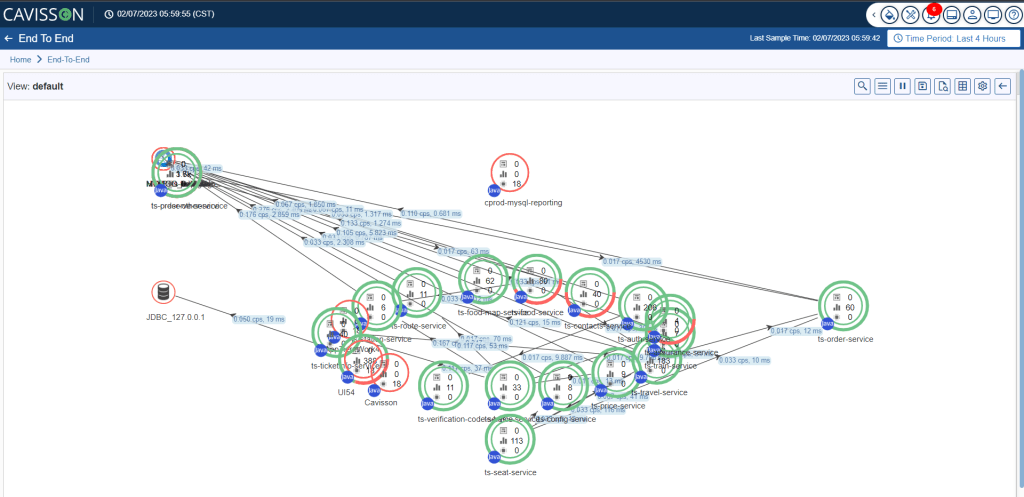
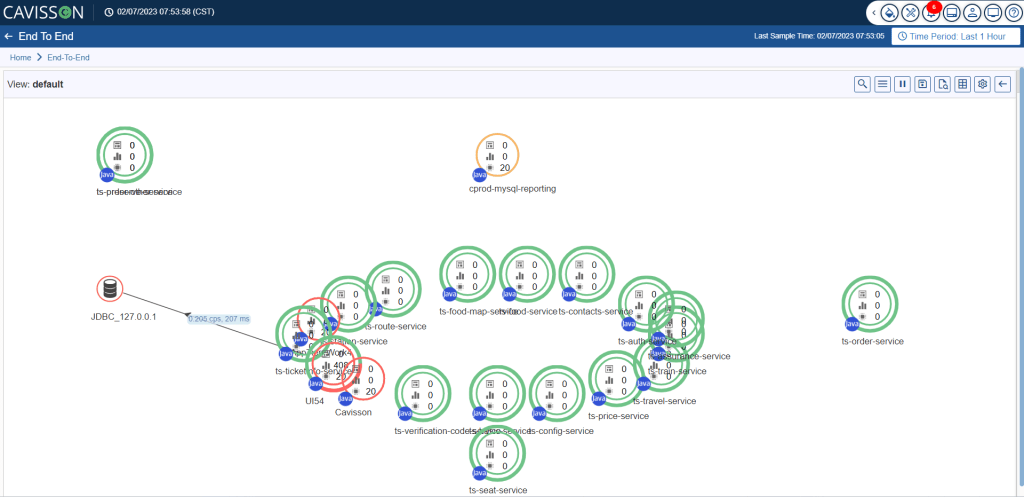
To load the default flow map, click on the Default option as shown in Figure 18. It is loaded by default at the time of accessing the application End-to-End View. You can also create a custom flow map and designate it as the default flow map.
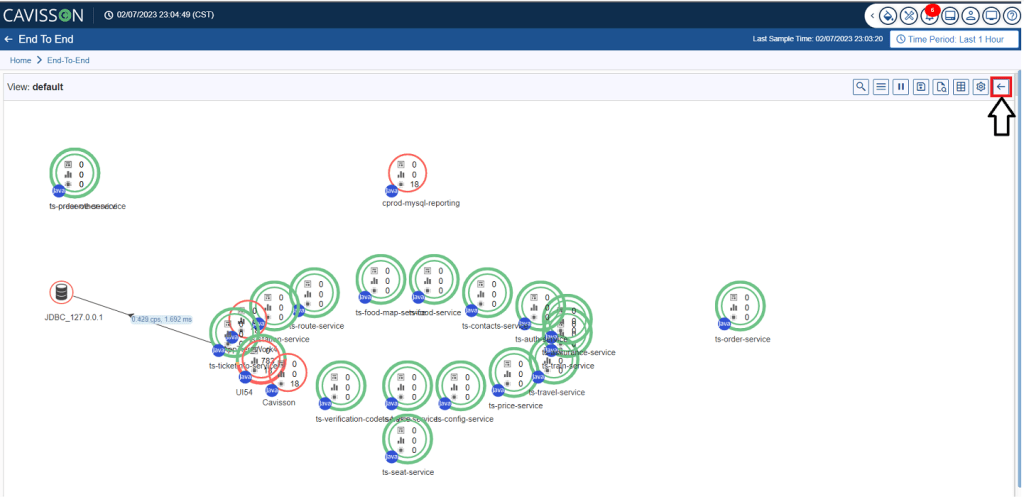
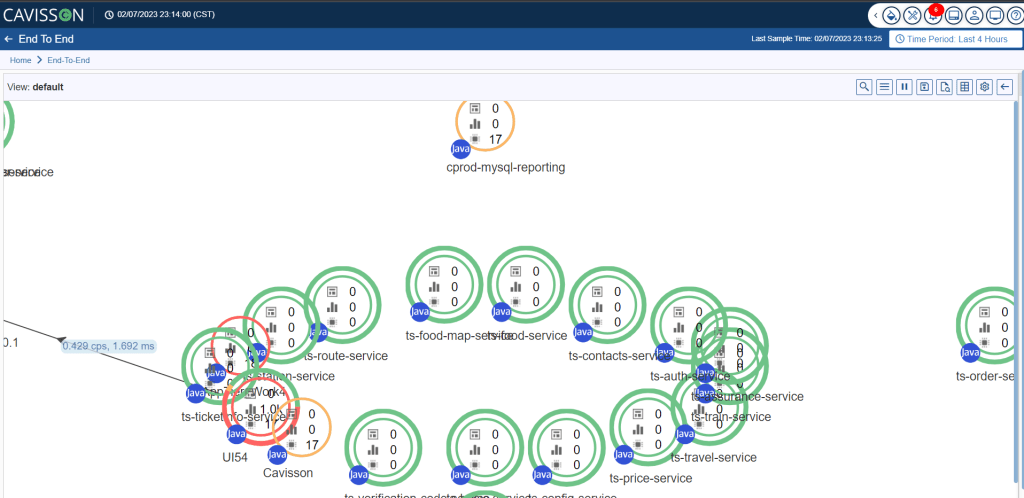
Pause/Start Request
The details of the flow maps are refreshed automatically every 2 minutes which is the progress interval of the test run. You can also pause the auto-refresh of the flow map details by clicking the Pause button ![]() . Upon clicking, the auto-refresh feature of the flow map is disabled and the button appearance changes to
. Upon clicking, the auto-refresh feature of the flow map is disabled and the button appearance changes to ![]() . To start the auto-refresh feature, click the
. To start the auto-refresh feature, click the ![]() button.
button.
 |
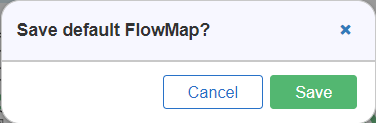
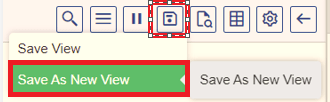
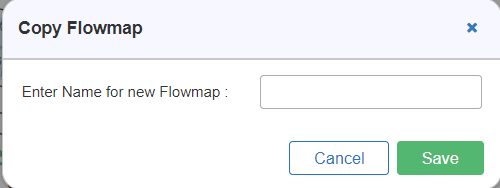
Save
Here, you can save the current view or save it as a new view (just like Save as). You have the following options within this section as shown in Figure 19.
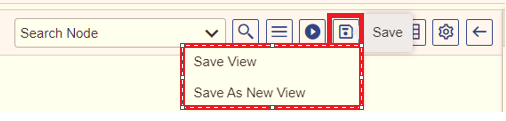
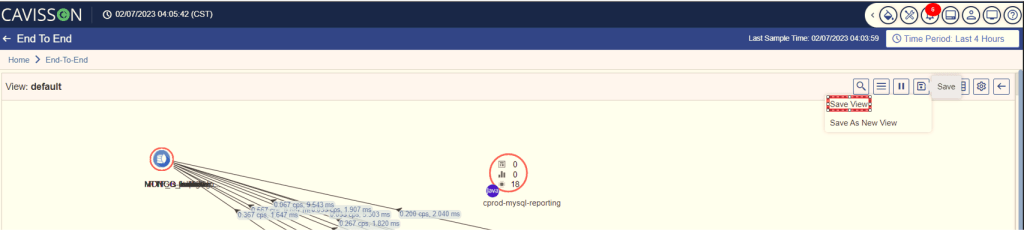
On clicking the save view option, the Save Default FlowMap window will appear. Click on the Save ![]() button to save the current view of the flowmap as shown in Figure 21.
button to save the current view of the flowmap as shown in Figure 21.

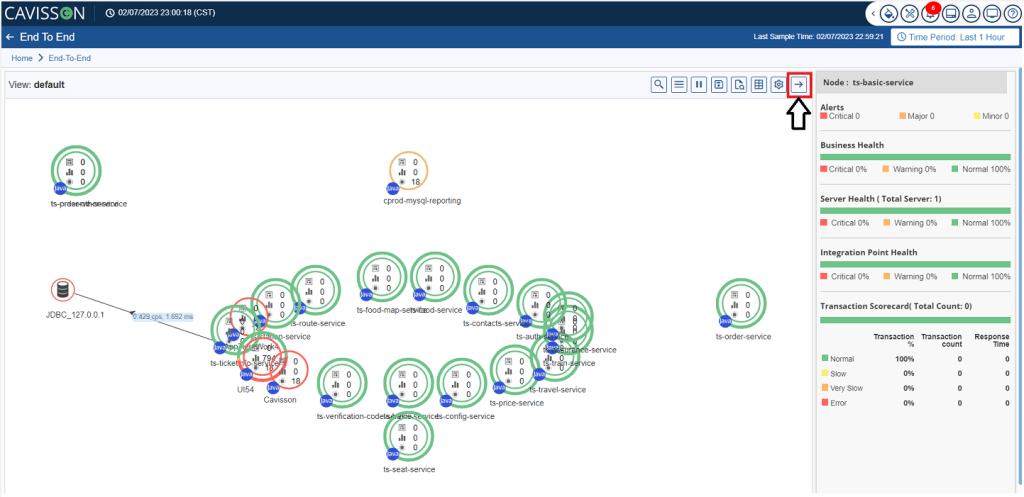
- By default, tier detail is displayed as shown in Figure 34. To view the integration point details to which the tier is connected, click the
 button. This expands the tier and displays the integration points.

To restore it to the previous view, click the Minimize ![]() button as marked in Figure 41.
button as marked in Figure 41.